

ENSO State and Georgia Winters

Entry posted by NorthGeorgiaWX
181 views
The main focus on this article is not to make a winter forecast, but to explore what effects El Nino's and teleconnections have on winter weather across the southeast. One of the main sources of data in this report comes from a weather friend of mine that I call "Brother Larry". Larry would prefer to remain anonymous, so from here on out you'll hear me refer to Larry as "Brother Larry". :-) Larry has a wealth of information about the weather history in Georgia, and I'll be using a lot of his findings to help give you an idea how this winter may turn out, based on the environment created by the El Nino, as well as several other factors. Again, this data is based on analog years, or those years that most closely identify with the current patterns, so keep that in mind. Analog's are not perfect, but they do give us a very good idea about how things have happened in the past and how they may happen again in the future.
Again, almost all of the text below (other than a few of my own edits and additions) is from Larry, and he gets all the credit for the research and stats.
Again, almost all of the text below (other than a few of my own edits and additions) is from Larry, and he gets all the credit for the research and stats.
ENSO and Southeast US Winters
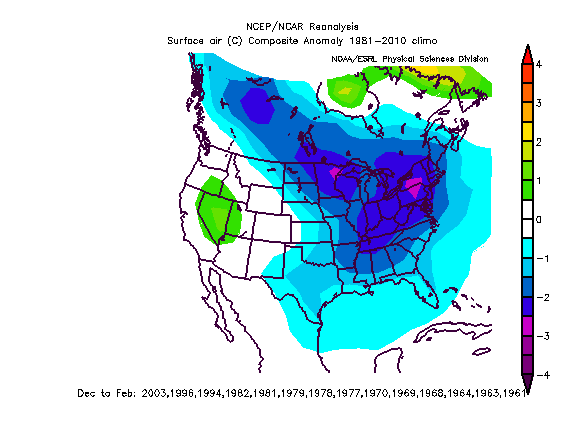
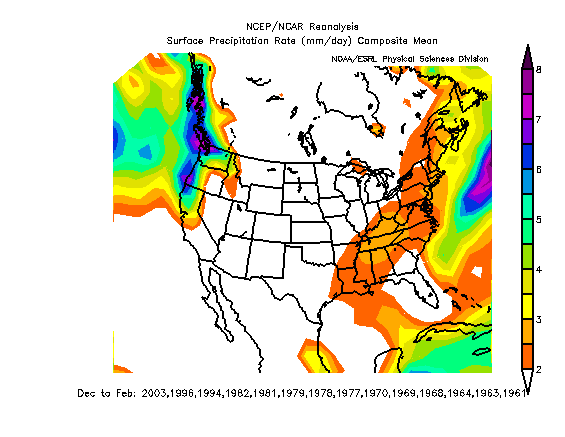
This data was compiled by taking a list of 26 “cold” US winters (Dec/Jan/Feb) since 1894 -1895 (i.e., the coldest 23%) for the eastern third of the US. This requires solid, widespread, below normal anomalies, and requires the southeast to be pretty chilly itself. The two maps to the right were created with data from the list of years below, but that dataset only goes back to 1948, so the maps I'm displaying are not 100% complete with the years in the list. Here's the list of those winters, and you can see the years I used on the maps themselves.
Also, Larry's 26 coldest winters study was done the better part of 10 years back, since then, it is possible that some of 09, 10, 13, 14, etc. could be added, although he is not reassessing those now.
Also, Larry's 26 coldest winters study was done the better part of 10 years back, since then, it is possible that some of 09, 10, 13, 14, etc. could be added, although he is not reassessing those now.
|
Nino Base State
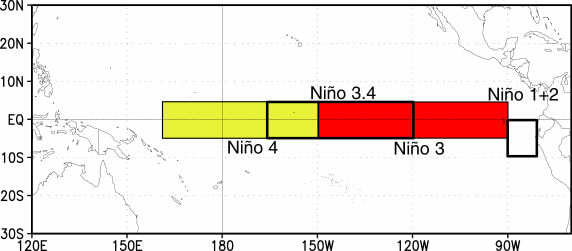
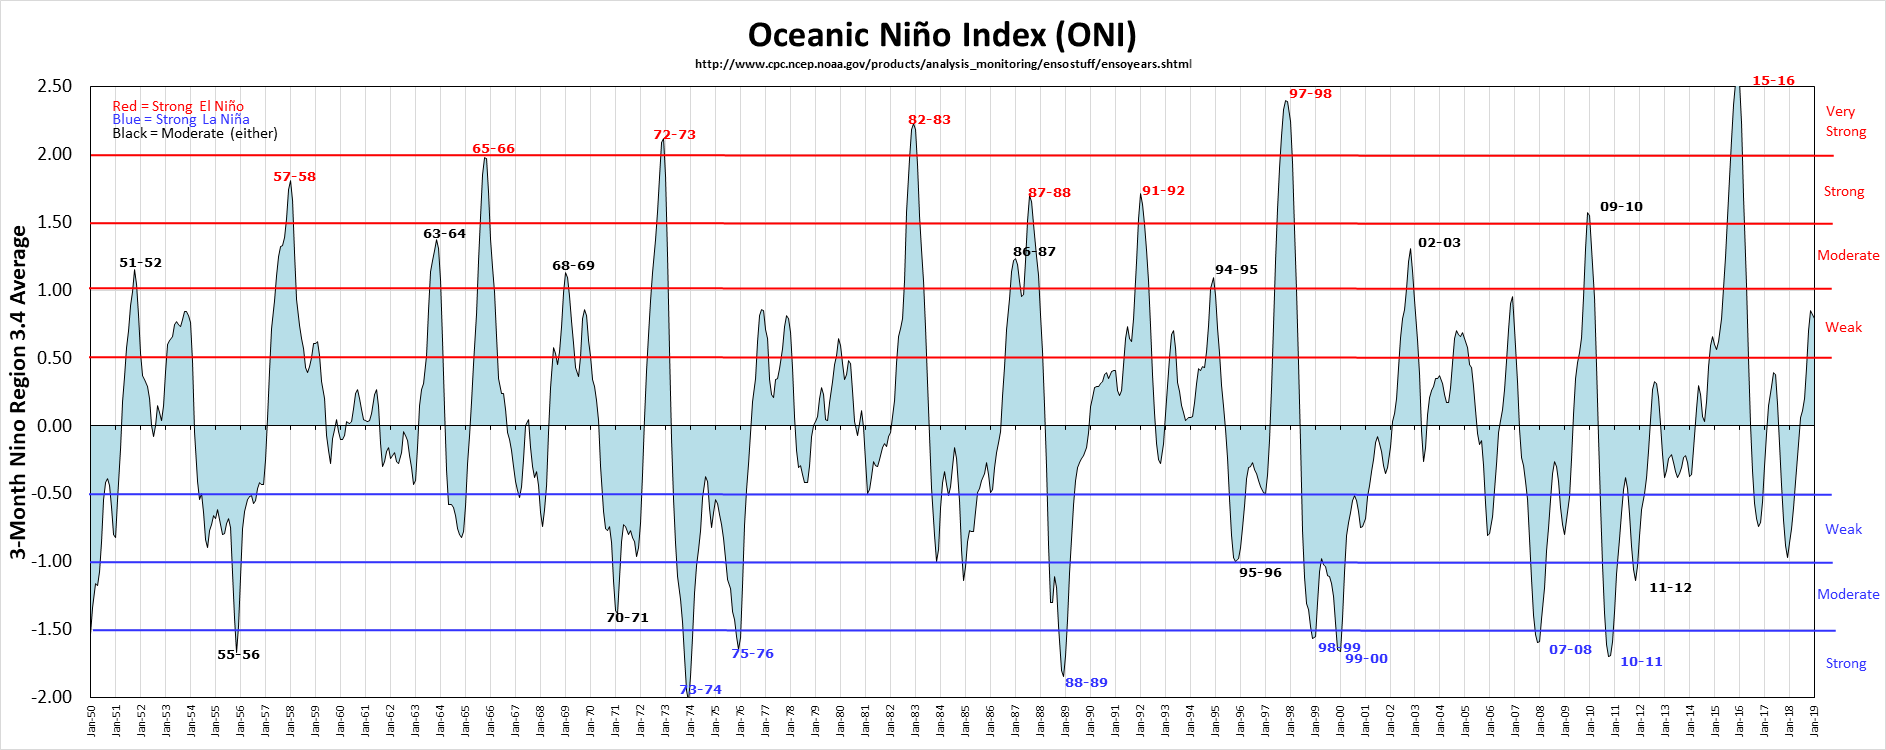
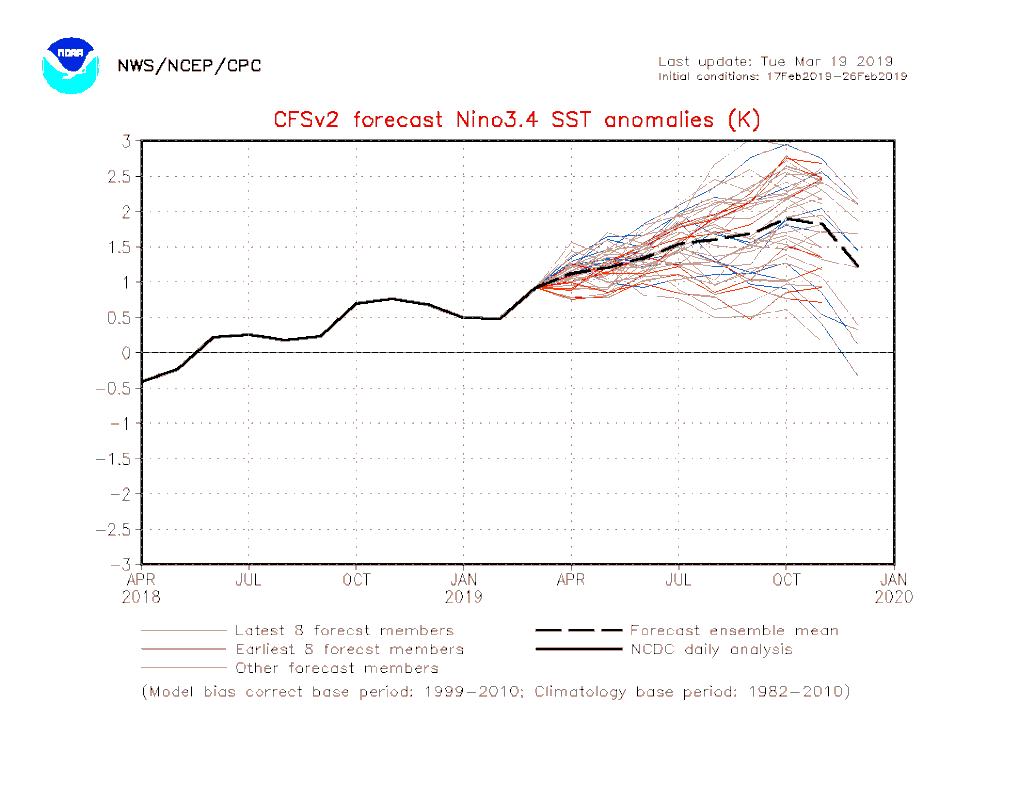
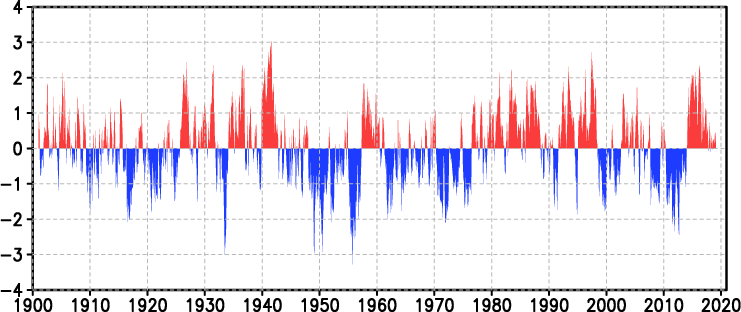
| So now that we have our list of base years, let's look at the base Nino state for those winters. Before we can do that, we need to take a look at the various Nino/Nina classifications. Graphs and Charts The Oceanic Niño Index (ONI) has become the standard that NOAA uses for identifying El Niño (warm) and La Niña (cool) events in the tropical Pacific. The ONI is defined as the running 3-month mean SST anomaly for the Niño 3.4 region (i.e., 50N-50S, 120W-170W). Events are defined as 5 consecutive overlapping 3-month periods at or above the +0.5 anomaly for warm (El Niño) events and at or below the -0.5 anomaly for cold (La Niña) events. The threshold is further broken down into:
|
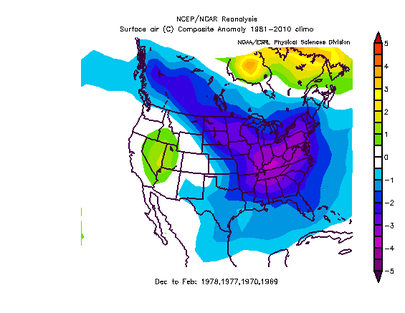
| Notice that out of all the cold years, the majority of them occurred during weak Nino's (35%). Also notice that out of all of those cold winters, none of them occurred with a strong Nino or a strong Nina. The map on the left depicts the temperature anomalies that occurred during a Weak Nino. Due to the data only going back to 1948, all of the years are not depicted, but this will give you a good idea. As you can see, a weak Nino is what we'd like to see come Dec-Feb. If the current one stays too strong, it could severely limit our cold this winter based on past analogs. keep in mind, Larry's study is based on temperatures, not precipitation. |
Nino and the Pacific Decadal Oscillation (PDO)
PDO Index (http://www.daculaweather.com/4_pdo_index.php)
While it's easy to look at one specific weather pattern, there are many factors that determine how a winter will turn out, with the ENSO state being just one of those. But there are other teleconnections and long term patterns that also have an effect on our winter weather, and they all work in tandem with each other. Graphs and Charts
Now we are going to turn our attention to the PDO state or Pacific Decadal Oscillation. First, the definition from the National Center for Environmental Information:
"The Pacific Decadal Oscillation (PDO) is often described as a long-lived El Niño-like pattern of Pacific climate variability (Zhang et al. 1997). As seen with the better-known El Niño/Southern Oscillation (ENSO), extremes in the PDO pattern are marked by widespread variations in the Pacific Basin and the North American climate. In parallel with the ENSO phenomenon, the extreme phases of the PDO have been classified as being either warm or cool, as defined by ocean temperature anomalies in the northeast and tropical Pacific Ocean. When SSTs are anomalously cool in the interior North Pacific and warm along the Pacific Coast, and when sea level pressures are below average over the North Pacific, the PDO has a positive value. When the climate anomaly patterns are reversed, with warm SST anomalies in the interior and cool SST anomalies along the North American coast, or above average sea level pressures over the North Pacific, the PDO has a negative value (Courtesy of Mantua, 1999). "
Here's an analysis of the cold 26 winters by DJF averaged PDO status:
- + PDO: 18 of 58 (31%)
- - PDO: 8 of 57 (14%)
Nino and the North Atlantic Oscillation (NAO)
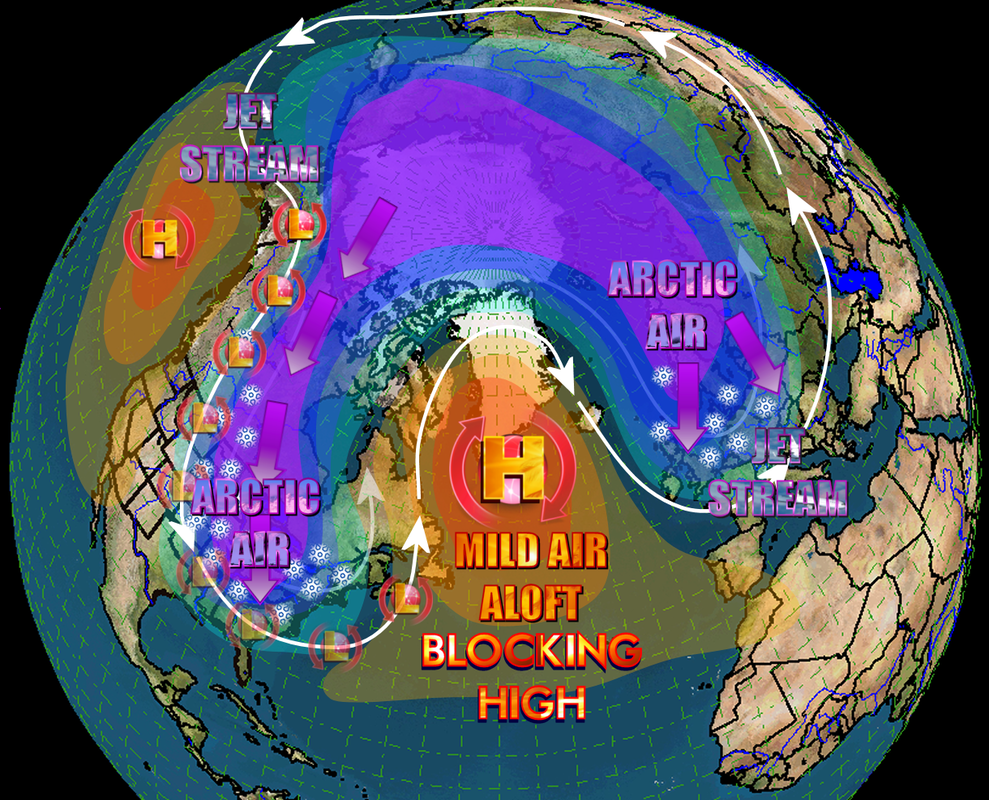
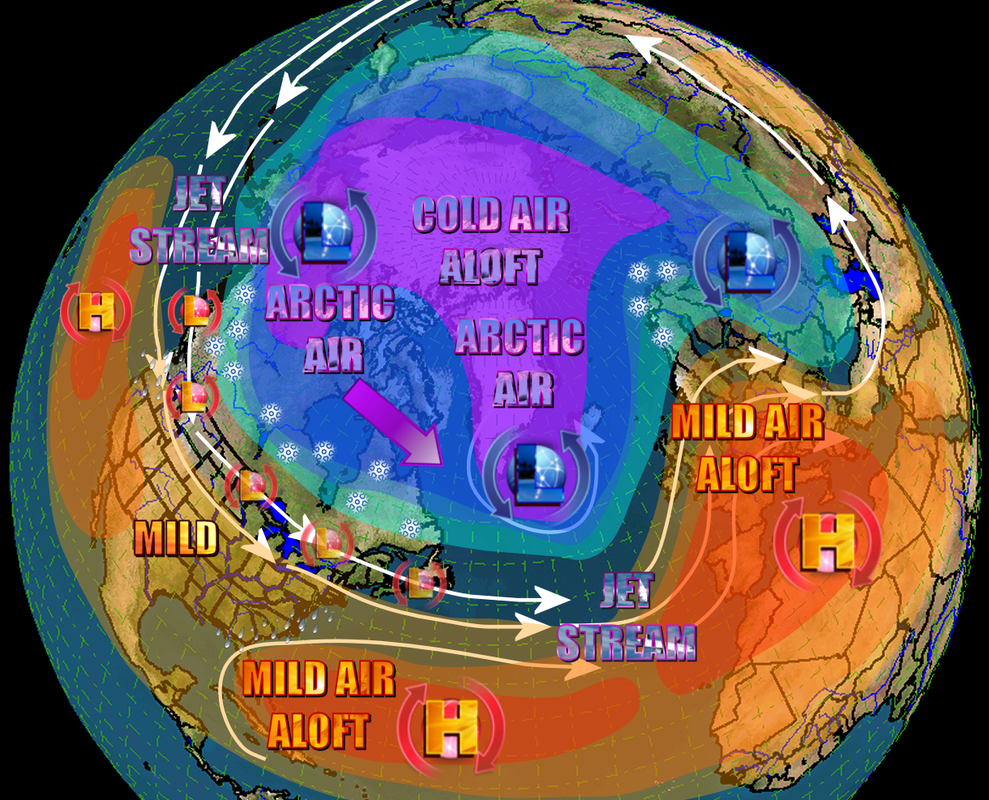
In order for us to get long lasting cold air that stays locked in, we need some blocking. There are several teleconnection patterns that aid in developing this blocking, one of which is the North Atlantic Oscillation or NAO. Graphs and Charts
Here's the definition of the NAO:
"The North Atlantic Oscillation (NAO) is a climatic phenomenon in the North Atlantic Ocean of fluctuations in the difference of atmospheric pressure at sea level between the Icelandic low and the Azores high. Through fluctuations in the strength of the Icelandic low and the Azores high, it controls the strength and direction of westerly winds and storm tracks across the North Atlantic. It is part of the Arctic Oscillation, and varies over time with no particular periodicity."
Strong positive phases of the NAO tend to be associated with above-average temperatures in the eastern United States and across northern Europe and below-average temperatures in Greenland and oftentimes across southern Europe and the Middle East. They are also associated with above-average precipitation over northern Europe and Scandinavia in winter, and below-average precipitation over southern and central Europe. Opposite patterns of temperature and precipitation anomalies are typically observed during strong negative phases of the NAO. For us, negative is what we're looking for in the winter.
Let's take a look at the analysis of the cold 26 Dec-Feb winters by averaged NAO status:
- – NAO: 19 of 48 (40%)
- + NAO: 7 of 67 (10%)
Piecing It All Together...
Now let's take the combination of the ENSO state (in our case, Nino), and factor in the PDO and NAO and let's see what we get. Here's the analysis of the 26 cold winters by a combination of Dec-Feb averaged PDO and NAO status:
- + PDO/-NAO: 12 of 25 (46%)
- - PDO/-NAO: 7 of 23 (30%) (all 7 had (PDO – NAO) > 0)
- + PDO/+NAO: 6 of 33 (18%)
- - PDO/+NAO: 1 of 34 (3%)
Now, let's really lay it out.
Here's "Brother Larry's" analysis of the 26 cold winters by a combination of ENSO state and Dec-Feb averaged PDO and NAO status:
Strong Nino:
Moderate Nino:
Weak Nino:
Neutral Positive:
Neutral Negative:
Weak Nina:
Moderate Nina:
Strong Nina:
Here's "Brother Larry's" analysis of the 26 cold winters by a combination of ENSO state and Dec-Feb averaged PDO and NAO status:
Strong Nino:
- +PDO/-NAO: 0 of 6 (0%)
- -PDO/-NAO: 0 of 1 (0%)
- +PDO/+NAO: 0 of 7 (0%)
- -PDO/+NAO: 0 of 1 (0%)
Moderate Nino:
- +PDO/-NAO: 1 of 2 (50%)
- -PDO/-NAO: 0 of 0 (N/A)
- +PDO/+NAO: 0 of 0 (N/A)
- -PDO/+NAO: 0 of 2 (0%)
Weak Nino:
- +PDO/-NAO: 6 of 7 (86%)
- -PDO/-NAO: 2 of 2 (100%)
- +PDO/+NAO: 1 of 2 (50%)
- -PDO/+NAO: 0 of 4 (0%)
Neutral Positive:
- +PDO/-NAO: 2 of 4 (50%)
- -PDO/-NAO: 0 of 3 (0%)
- +PDO/+NAO: 2 of 10 (20%)
- -PDO/+NAO: 0 of 5 (0%)
Neutral Negative:
- +PDO/-NAO: 1 of 3 (33%)
- -PDO/-NAO: 2 of 7 (29%)
- +PDO/+NAO: 2 of 10 (20%)
- -PDO/+NAO: 0 of 5 (0%)
Weak Nina:
- +PDO/-NAO: 2 of 2 (100%)
- -PDO/-NAO: 3 of 5 (60%)
- +PDO/+NAO: 1 of 4 (25%)
- -PDO/+NAO: 0 of 7 (0%)
Moderate Nina:
- +PDO/-NAO: 0 of 1 (0%)
- -PDO/-NAO: 0 of 3 (0%)
- +PDO/+NAO: 0 of 0 (N/A)
- -PDO/+NAO: 1 of 4 (25%)
Strong Nina:
- +PDO/-NAO: 0 of 0 (N/A)
- -PDO/-NAO: 0 of 2 (0%)
- +PDO/+NAO: 0 of 0 (N/A)
- -PDO/+NAO: 0 of 6 (0%)
Conclusions...
- Weak Nino’s give the highest percentage chance for cold of any of the ENSO states by far (with weak Nina’s second); however, a combo of -PDO/+NAO seems to make it difficult even for weak Nino’s.
- A very impressive 13 of 16 (81%) of the aggregate of weak Nino's and weak Nina's with -NAO were cold.
- Don't ever bet on cold with either a strong Nino or a strong Nina since none of the 23 were cold.
- +PDO about doubles the percent chance for cold versus a -PDO.
- A -NAO more than doubles the percentage chance for cold versus a +NAO and a somewhat higher chance than a +PDO gives. So, I give small edge to –NAO over a +PDO regarding cold prospects. Regardless, both are very important.
- A +PDO/-NAO combo gives close to twice the percentage chance for cold versus the percentage chance for all PDO/NAO combos in the aggregate.
- A -PDO/-NAO is the next best combo for cold prospects, but mainly if NAO is more negative than PDO.
- Don't ever bet on cold with a combination of -PDO/+NAO, since only 1 out of 34 were cold.
- If there is a +PDO, the chances for a –NAO appear to be high for only weak to moderate Nino’s. The chances appear to only be about 50-50 for strong Nino’s. For neutral ENSO, the chances seem to be surprisingly low (partial negative correlation suggested).
- The best shot at a +PDO/-NAO combo appears to be with a weak to moderate Nino's. On the other hand, only 3 of 34 (9%) Nina’s had a +PDO/-NAO.
- A pretty high 17 of 34 (50%) Nina’s had a –PDO/+NAO.
- A +PDO is difficult with a moderate to strong Nina. Only one out of 16 (6%) had one.
- A –PDO seems rather difficult with a strong Nino, only 2 out of 15 (13%) had one.
- +PDO and –PDO winters are about evenly split. But +NAO winters have been a bit more common than -NAO in long term: 58% vs. 42%.
Winter Precipitation
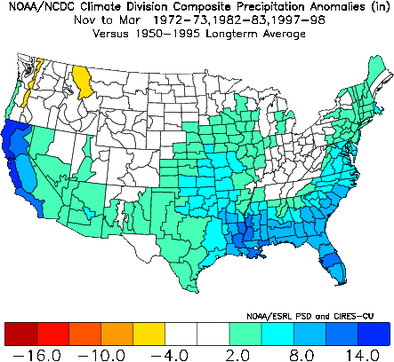
Regarding wintry precipitation for Atlanta, when looking at the three standalone super Nino's (1972-1973, 1982 -1983, 1997-1998) as well as the six strong to super strong 2nd year Nino's (1877-1888, 1888-1889, 1896-1887, 1905-1906, 1940-1941, 1987-1988), Atlanta more often than not, had one major winter storm, but not always:
- 1877-1888: 2.5" 1/3/1878 & a non-major freezing rain followed on 1/9/1878
- 1888-1889: 6" 2/21/1889
- 1896-1967: 6.2" 12/2/1896
- 1905-1906: 6.2" for the season including 3.5"+ major 1/26/1906, measurable snow D, J, and F
- 1940 -1941: only T of snow
- 1972 -1973: historic ZR 1/7-8/1973, which included 1" mainly ice pellets; (also, historic snow hit central GA in Feb though Atlanta missed that one)
- 1982 -1983: 10.3" S/IP for season including 7.9" 3/24/1983 (heaviest since 1940) and measurable snow J, F, and M
- 1987- 1988: 4.2" of mainly IP 1/7/1988 (would have been ~8" if all snow)
- 1997- 1998: only 0.6" 12/29/1997
0 Comments
Recommended Comments
There are no comments to display.